
Zoe Loh, CSIRO; Helen Cleugh, CSIRO; Paul Krummel, CSIRO, and Ray Langenfelds, CSIRO
COVID-19 has curtailed the activities of millions of people across the world and with it, greenhouse gas emissions. As climate scientists at the Cape Grim Baseline Air Pollution Station, we are routinely asked: does this mean carbon dioxide concentrations in the atmosphere have fallen?
The answer, disappointingly, is no. Throughout the pandemic, atmospheric carbon dioxide (CO₂) levels continued to rise.
In fact, our measurements show more CO₂ accumulated in the atmosphere between January and July 2020 than during the same period in 2017 or 2018.
Emissions from last summer’s bushfires may have contributed to this. But there are several other reasons why COVID-19 has not brought CO₂ concentrations down at Cape Grim – let’s take a look at them.
Measuring the cleanest air in the world
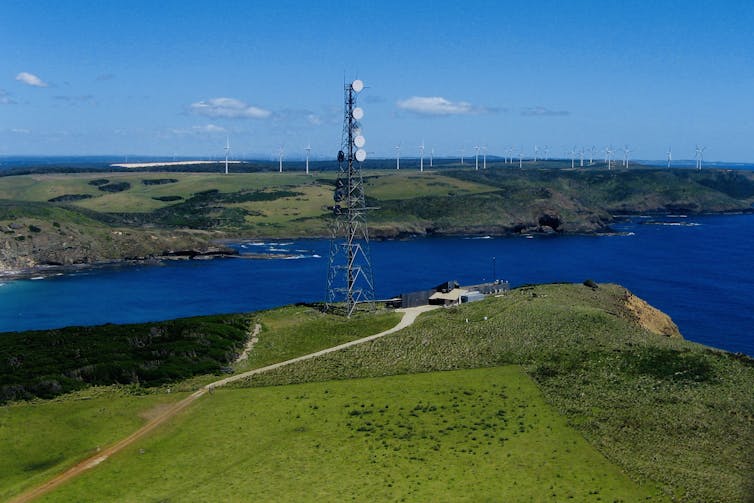
Cape Grim is on the northwest tip of Tasmania. Scientists at the station, run by the CSIRO and Bureau of Meteorology, have monitored and studied the global atmosphere for the past 44 years.
The air we monitor is the cleanest in the world when it blows from the southwest, off the Southern Ocean. Measurements taken during these conditions are known as “baseline concentrations”, and represent the underlying level of carbon dioxide in the Southern Hemisphere’s atmosphere.


A drop in the CO₂ ocean
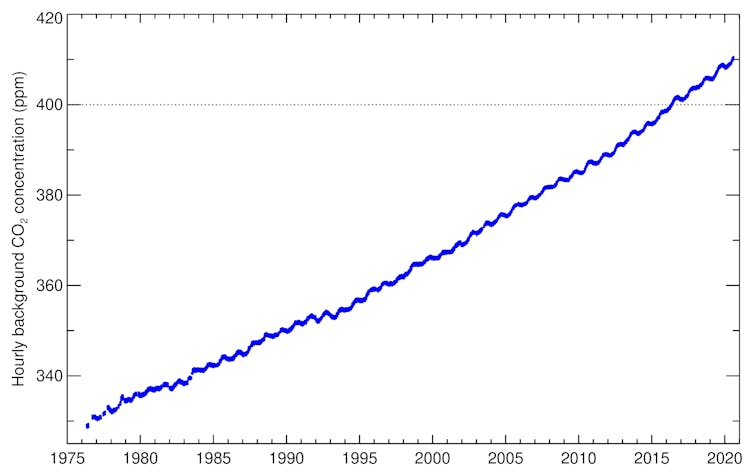
Emissions reductions due to COVID-19 started in China in January, and peaked globally in April. Our measurements show atmospheric CO₂ levels rose during that period. In January 2020, baseline CO₂ was 408.3 parts per million (ppm) at Cape Grim. By July that had risen to 410 ppm.
Since the station first began measurements in 1976, carbon dioxide levels in the atmosphere have increased by 25%, as shown in the graph below. The slowdown in the rate of carbon emissions during the pandemic is a mere tug against this overall upward trend.
The CO₂ increase is due to the burning of fossil fuels for energy, and land use change such as deforestation which leaves fewer trees to absorb CO₂ from the air, and changes the uptake and release of carbon in the soils.
Atmospheric transport
Large air circulation patterns in the atmosphere spread gases such as CO₂ around the world, but this process takes time.
Most emissions reduction due to COVID-19 occurred in the Northern Hemisphere, because that’s where most of the world’s population lives. Direct measurements of CO₂ in cities where strict lockdown measures were imposed show emissions reductions of up to 75%. This would have reduced atmospheric CO₂ concentrations locally.
But it will take many months for this change to manifest in the Southern Hemisphere atmosphere – and by the time it does, the effect will be significantly diluted.
Natural ups and downs
Emissions reductions during COVID-19 are a tiny component of a very large carbon cycle. This cycle is so dynamic that even when the emissions slowdown is reflected in atmospheric CO₂ levels, the reduction will be well within the cycle’s natural ebb and flow.
Here’s why. Global carbon emissions have grown by about 1% a year over the past decade. This has triggered growth in atmospheric CO₂ levels of between 2 and 3 ppm per year in that time, as shown in the graph below. In fact, since our measurements began, CO₂ has accumulated more rapidly in the atmosphere with every passing decade, as emissions have grown.
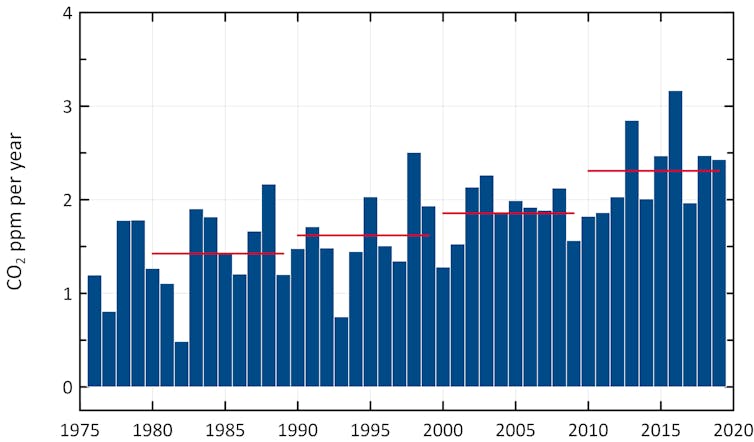
But although CO₂ emissions have grown consistently, the resulting rate of accumulation in the atmosphere varies considerably each year. This is because roughly half of human emissions are mopped up by ecosystems and the oceans, and these processes change from year to year.
For example, in southeast Australia, last summer’s extensive and prolonged bushfires emitted unusually large amounts of CO₂, as well as changing the capacity of ecosystems to absorb it. And during strong El Niño events, reduced rainfall in some regions limits the productivity of grasslands and forests, so they take up less CO₂.
The graph below visualises this variability. It shows the baseline CO₂ concentrations for each year, relative to January 1. Note how the baseline level changes through a natural seasonal cycle, how that change varies from year to year and how much CO₂ has been added to the atmosphere by the end of the year.
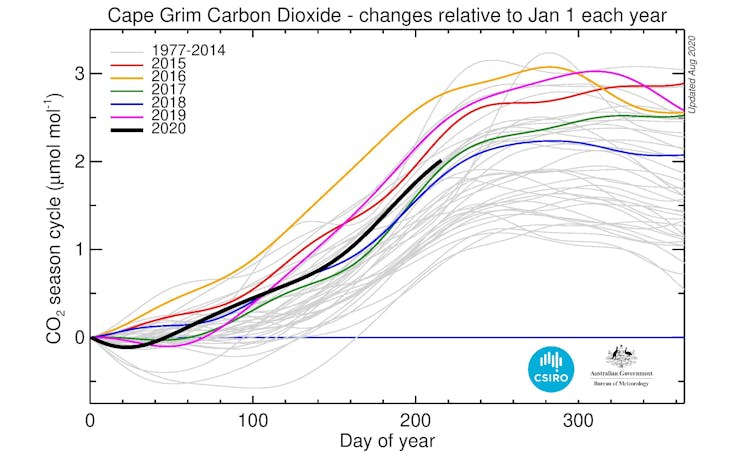
The growth rate has been as much as 3 ppm per year. The black line represents 2020 and lines for the preceding five years are coloured. All show recent annual growth rates of about 2-3 ppm/year – a variability in the range of about 1 ppm/year.
Research in May estimated that due to the COVID-19 lockdowns, global annual average emissions for 2020 would be between 4.2% and 7.5% lower than for 2019.
Let’s simplistically assume CO₂ concentration growth reduces by the same amount. There would be 0.08-0.23 ppm less CO₂ in the atmosphere by the end of 2020 than if no pandemic occurred. This variation is well within the natural 1 ppm/year annual variability in CO₂ growth.
The road ahead
It’s clear COVID-19 has not solved the climate change problem. But this fact helps us understand the magnitude of change required if we’re to stabilise the global climate system.
The central aim of the Paris climate agreement is to limit global warming to well below 2℃, and pursue efforts to keep it below 1.5℃. To achieve this, global CO₂ emissions must decline by 3% and 7% each year, respectively, until 2030, according to the United Nations Emissions Gap Report.
Thanks to COVID-19, we may achieve this reduction in 2020. But to lock in year-on-year emissions reductions that will be reflected in the atmosphere, we must act now to make deep, significant and permanent changes to global energy and economic systems.
The lead author, Zoe Loh, discusses the CO₂ record from Cape Grim in Fight for Planet A, showing now on the ABC.
Zoe Loh, Senior Research Scientist, CSIRO; Helen Cleugh, Senior research scientist, CSIRO Climate Science Centre, CSIRO; Paul Krummel, Research Group Leader, CSIRO, and Ray Langenfelds, Scientist at CSIRO Atmospheric Research, CSIRO
This article is republished from The Conversation under a Creative Commons license. Read the original article.