• Advertise
  • About us
  • Terms and Conditions
  • Contact us
Friday, February 6, 2026
Australian Times News
  • News
    • Weather
    • Sport
    • Technology
    • Business & Finance
      • Currency Zone
    • Lotto Results
      • The Lott
  • Lifestyle
    • Entertainment
    • Horoscopes
    • Health & Wellness
    • Recipes
  • Travel
  • Expat Life
  • Move to Australia
No Result
View All Result
  • News
    • Weather
    • Sport
    • Technology
    • Business & Finance
      • Currency Zone
    • Lotto Results
      • The Lott
  • Lifestyle
    • Entertainment
    • Horoscopes
    • Health & Wellness
    • Recipes
  • Travel
  • Expat Life
  • Move to Australia
No Result
View All Result
Australian Times News
No Result
View All Result
Home News

Warming is clearly visible in new US ‘climate normal’ datasets

The National Oceanic and Atmospheric Administration has released updated “climate normals” – datasets that the agency produces every 10 years to give forecasters and the public baseline measurements of average temperature, rainfall and other conditions across the U.S.

The Conversation by The Conversation
08-05-2021 18:05
in News
Photo by Red Zeppelin on Unsplash

Photo by Red Zeppelin on Unsplash

Russ Schumacher, Colorado State University and Becky Bolinger, Colorado State University

Anyone who listens to weather reports has heard meteorologists comment that yesterday’s temperature was 3 degrees above normal, or last month was much drier than normal. But what does “normal” mean in this context – and in a world in which the climate is changing?

The National Oceanic and Atmospheric Administration has released updated “climate normals” – datasets that the agency produces every 10 years to give forecasters and the public baseline measurements of average temperature, rainfall and other conditions across the U.S. As the state climatologist and assistant state climatologist for Colorado, we work with this information all the time. Here’s what climate normals are, how they’ve changed, and how you can best make sense of them.

What are the new normals?

NOAA’s National Centers for Environmental Information released the new set of normals, covering 1991-2020, on May 4, 2021. Climatologists have been performing calculations on data from long-term observing stations around the country for a wide range of parameters, including high and low temperature, precipitation and snowfall.

The data also includes more detailed statistics, like the normal number of days below freezing or those with more than an inch of snowfall. NOAA puts data from individual stations onto a grid to enable the creation of useful maps for the entire country, even in places with relatively few observing stations. This provides a wealth of information for anyone interested in the climate of a specific area.

Why are normals updated?

The World Meteorological Organization sets international standards for climatological normals, defined as a 30-year periods that are regularly updated. The idea is to have global consistency for analysis. The 30-year normals also create a benchmark that represents recent climate conditions and serves as a reference for assessing current conditions.

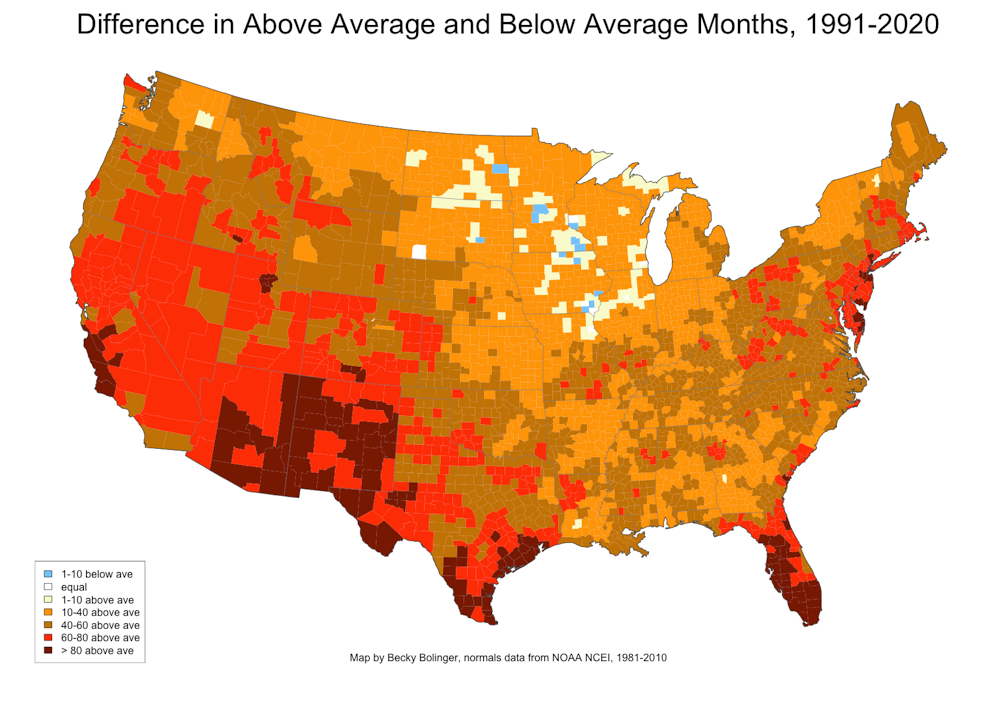
Climate change highlights the need for regularly updating these normals. For the past 10 years, weather professionals have used the 1981-2010 climate normals as our reference. But we’ve observed above-average temperatures much more frequently than below-average temperatures from 1991-2020 for much of the U.S. Updating the normals is a way to calibrate to our most recently observed climate.

AlsoRead...

Brandon Willington: The Marketing Entrepreneur turning heads across Australia

Brandon Willington: The Marketing Entrepreneur Turning Heads Across Australia

8 January 2026
How Turnkey Building Group Is Restoring Trust In An Industry Known For Customer Disappointment

How Turnkey Building Group Is Restoring Trust In An Industry Known For Customer Disappointment

17 December 2025

And as the climate continues to change, the further away in time we get from the “normal” period, the less representative that period will become. Using a very long period of time, or not regularly updating the period, could lead to including observations that would be extremely unlikely in our climate today.

On the other hand, there are situations in which it makes sense to consider periods longer than 30 years – for example, to understand long-term changes to the climate or to monitor extremes.

Most of the U.S. had more months in 1991-2020 that were warmer than the 1981-2010 average than months that were colder.
Difference in the number of months that had above-normal vs. below-normal temperature by county for the period 1991-2020, with respect to the 1981-2010 normals. Areas in red and brown had far more months that were were warmer than normal. Becky Bolinger, CC BY-ND

The concept of ‘normal’ in weather and climate

An old saying, often attributed to Mark Twain, asserts that “climate is what you expect, and weather is what you get.” Calculations of normal climate conditions for particular locations show how this works.

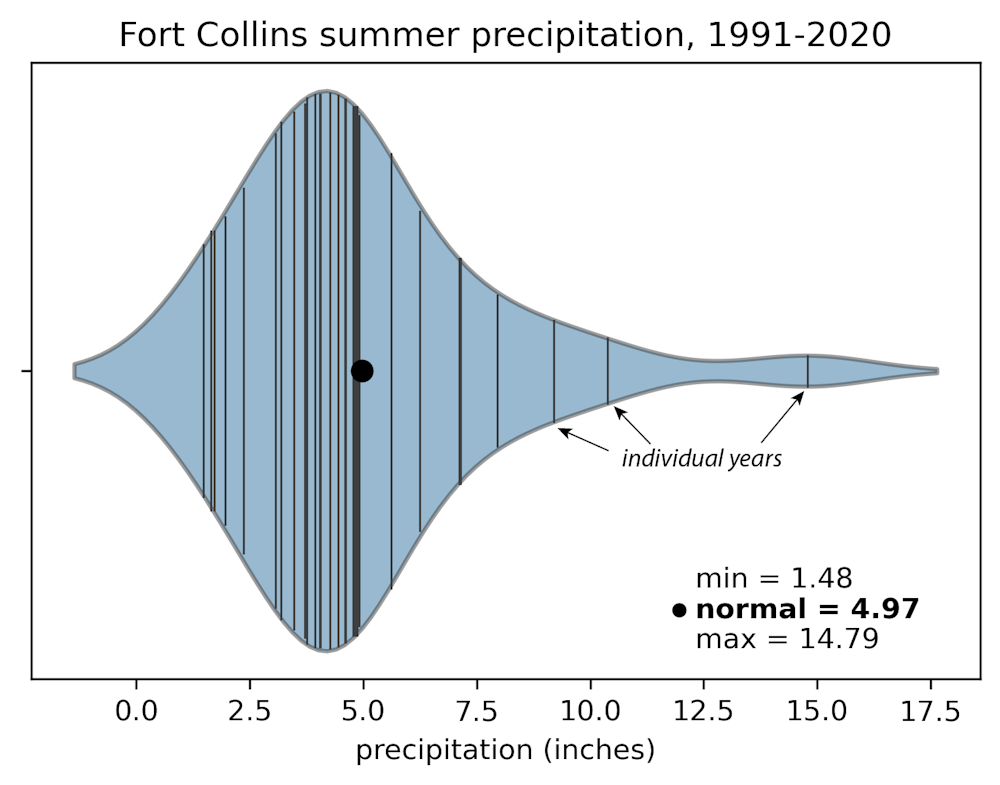
For example, data from the long-term weather and climate observing station in Fort Collins, Colorado, where we work, shows that precipitation in summer (June, July and August) over the 30 years from 1991 to 2020 varied significantly from year to year. The lowest summer rainfall was 1.48 inches in 2002 and the highest was 14.79 inches in 1997. Most years, it’s somewhere between 3 and 5 inches.

But few years match the average value, just shy of 5 inches. So even though we call this the “normal” amount of rainfall, in most years the total is higher or lower – sometimes by quite a bit.

Average summer precipitation in Fort Collins, Colorado, can vary by a factor of 10 from year to year.
Summer precipitation at Fort Collins, Colorado, for the years 1991-2020. The black circle indicates the 30-year average precipitation of 4.97 inches. Russ Schumacher and Becky Bolinger, CC BY-ND

Looking at summer temperatures from the same station, let’s compare the previous 30-year period, 1981-2010, with the most recent 30-year period, 1991-2020. The data shows a shift toward higher temperatures between the two time periods. The normal summer temperature increased by nearly 1 degree, from 69.6 to 70.4 F. This “new normal” for the past 30 years reflects climate warming that has occurred both locally and globally.

Comparing the 1981-2010 and 1991-2020 normals for Fort Collins, Colorado, shows how summers there are warming. The black circle indicates the average value for each time period. Credit: Russ Schumacher and Becky Bolinger.

What the new normals show

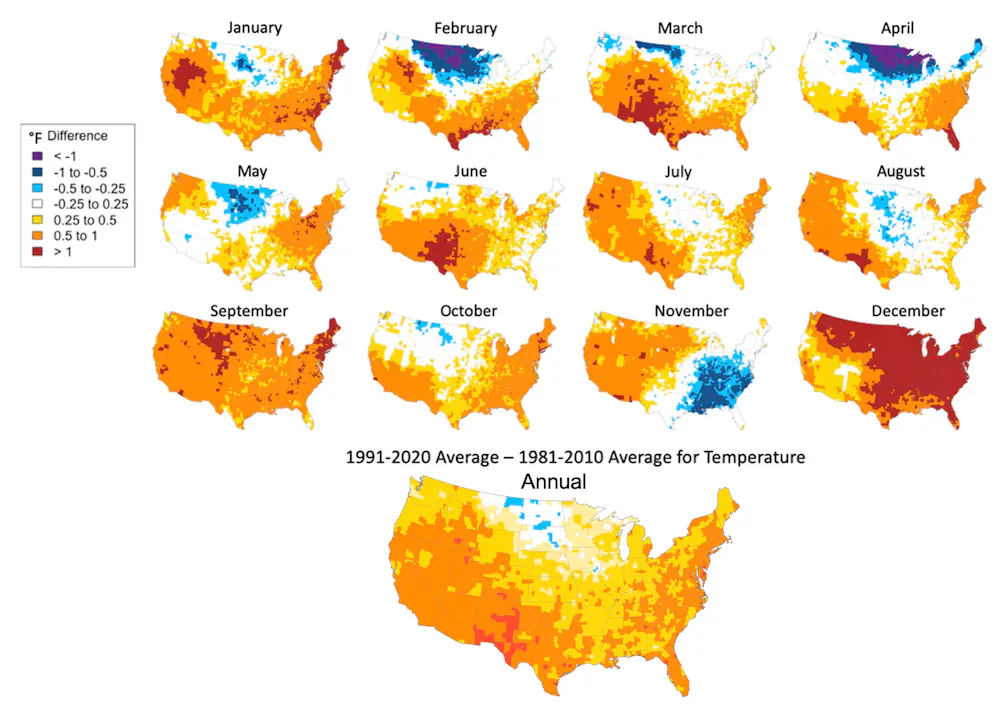
The key change that’s reflected in shifting from the 1981-2010 normals to the new 1991-2020 set is dropping the 1980s and adding the 2010s. The climate has been warming, so the new normals show higher temperatures for most regions and most months of the year.

Across the continental U.S., the temperature rose by about 0.5 F on average from the 1981-2010 to 1991-2020 period. The new average is 1.2 F warmer than that of the 20th century. A couple of exceptions are cooling observed in the spring over the Northern Great Plains and cooling over the Southeast and Mid-Atlantic in November. December shows the greatest amount of warming.

Average temperatures were higher across most of the U.S. in 1991-2020 than in 1981-2010.
Difference between 1991-2020 average and 1981-2010 average temperatures for each month, with annual change in the bottom panel. Oranges and reds show where the new normals are warmer; blues and purples show where the new normals are cooler. Russ Schumacher and Becky Bolinger, data from NOAA, CC BY-ND

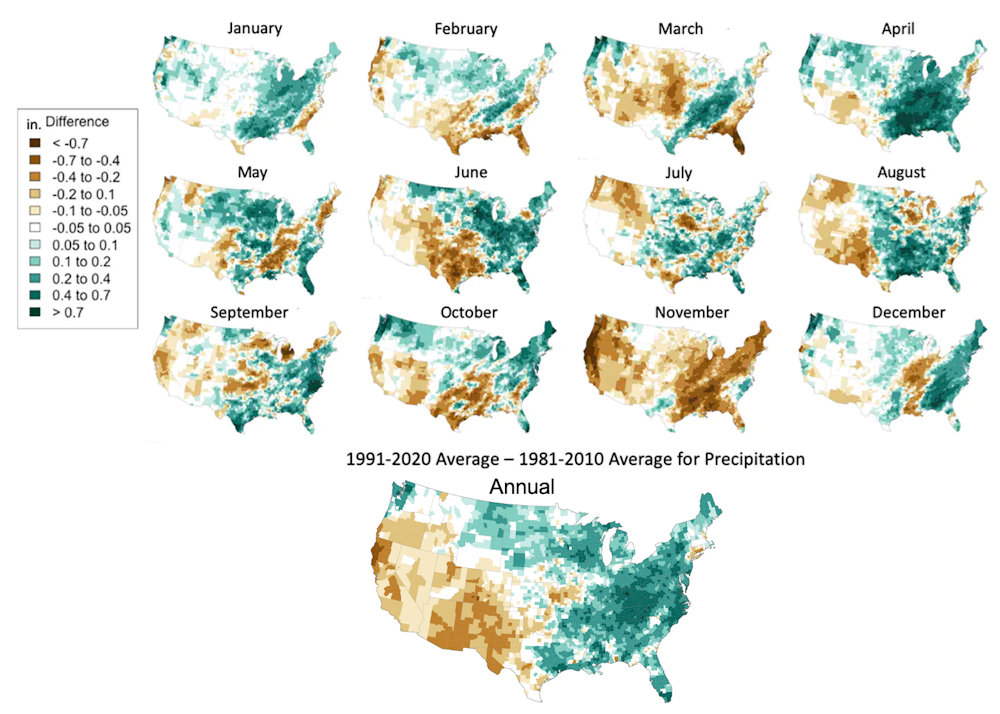
Precipitation is more variable than temperature from year to year and decade to decade. As a result, the changes in normal precipitation represent a mix of effects from long-term climate change and natural variations.

Overall, the 2010s were very wet in much of the central and eastern U.S. and dry in the west, and the normals reflect that. Average annual rainfall in Houston increased by over an inch, to 55.6 inches per year, while at Phoenix, Arizona, it dropped from an already dry 8.02 inches to a parched 7.22 inches per year.

On a monthly basis, some of the most notable patterns to emerge are widespread drying in November, particularly over the Gulf states and along the Pacific Coast, and a wetter pattern over the eastern half of the country in April.

Most of the Central and Eastern U.S. was wetter in 1991-2020 than in 1981-2010, while most Western states were drier.
Difference between 1991-2020 average and 1981-2010 average precipitation for each month, with the annual change in the bottom panel. Browns shading shows where the new normals are drier; green shading shows where the new normals are wetter. Russ Schumacher and Becky Bolinger, data from NOAA, CC BY-ND

Shifting to new climate normals can have counterintuitive effects. For example, in the next few years there may be a better chance that you’ll see what are now described as cooler-than-normal temperatures in a given day or month. Using Fort Collins again as an example, before the update, a summer average temperature of 70 F would have been slightly warmer than normal. Now that same summer would go down as being slightly cooler than normal, even though it would still be warmer than around 100 of the 127 years in the history of that location.

Meteorologists and climatologists are already starting to incorporate these new normals into our work. But when you hear the term “normal,” keep in mind that it reflects a 30-year snapshot and represents a different reality today than it did 30, 60 or 100 years ago.

[Get our best science, health and technology stories. Sign up for The Conversation’s science newsletter.]

Russ Schumacher, Associate Professor of Atmospheric Science and Colorado State Climatologist, Colorado State University and Becky Bolinger, Assistant State Climatologist and Research Scientist in Atmospheric Science, Colorado State University

This article is republished from The Conversation under a Creative Commons license. Read the original article.

Tags: SB001
DMCA.com Protection Status

SUBSCRIBE to our NEWSLETTER

[mc4wp_form id=”2384248″]

Don't Miss

Lyca Mobile Australia’s Customer-First Overhaul Pays Off with Finder Award Win

by Fazila Olla-Logday
2 February 2026
Lyca Mobile Australia's Customer-First Overhaul Pays Off with Finder Award Win
Technology

Lyca Mobile Australia’s customer-first overhaul has earned a Finder Award, recognising its improved value, service, and stronger focus on Australian...

Read moreDetails

From Driveway to Dream Court: The Rise of High-Performance Hoops at Home in 2026

by Fazila Olla-Logday
20 January 2026
The Rise of High-Performance Hoops at Home in 2026
Sport

High-performance home basketball hoops are gaining momentum in 2026, as more homeowners invest in durable, professional-grade systems that combine advanced...

Read moreDetails

Brandon Willington: The Marketing Entrepreneur Turning Heads Across Australia

by Pauline Torongo
8 January 2026
Brandon Willington: The Marketing Entrepreneur turning heads across Australia
Business & Finance

Brandon Willington, founder of “Where U?” is changing the narrative for Australian businesses tired of inconsistent leads and empty promises.

Read moreDetails

How Turnkey Building Group Is Restoring Trust In An Industry Known For Customer Disappointment

by Fazila Olla-Logday
17 December 2025
How Turnkey Building Group Is Restoring Trust In An Industry Known For Customer Disappointment
Business & Finance

Turnkey Building Group is changing the narrative in an industry often associated with missed deadlines and broken promises. By prioritizing...

Read moreDetails

Risk Awareness for International Travellers – What Australians Should Know Before Entering Multi-State Regions

by Fazila Olla-Logday
10 December 2025
Schengen
Travel

This guide helps Australian travellers understand cross-border requirements, assess political and environmental risks, manage health and safety considerations, and prepare...

Read moreDetails

The evolution of Aesthetic Surgery through the lens of Dr Kourosh Tavakoli

by Pauline Torongo
4 December 2025
The evolution of Aesthetic Surgery through the lens of Dr. Kourosh Tavakoli
Health & Wellness

As global interest in Australian cosmetic surgery continues to grow, the combination of regulation, research and emerging digital tools is...

Read moreDetails

Ryan: Building real freedom through e-commerce

by Pauline Torongo
27 November 2025
Ryan: Building real freedom through e-commerce
Business & Finance

Ryan’s greatest achievement isn’t any single business or revenue milestone — it’s the ecosystem he’s built through the Change community.

Read moreDetails
Load More

Copyright © Blue Sky Publications Ltd. All Rights Reserved.
australiantimes.co.uk is a division of Blue Sky Publications Ltd. Reproduction without permission prohibited. DMCA.com Protection Status

  • About us
  • Write for Us
  • Advertise
  • Contact us
  • T&Cs, Privacy and GDPR
No Result
View All Result
  • News
    • Weather
    • Sport
    • Technology
    • Business & Finance
      • Currency Zone
    • Lotto Results
      • The Lott
  • Lifestyle
    • Entertainment
    • Horoscopes
    • Health & Wellness
    • Recipes
  • Travel
  • Expat Life
  • Move to Australia

Copyright © Blue Sky Publications Ltd. All Rights Reserved.
australiantimes.co.uk is a division of Blue Sky Publications Ltd. Reproduction without permission prohibited. DMCA.com Protection Status